Dashboard & trading calendar
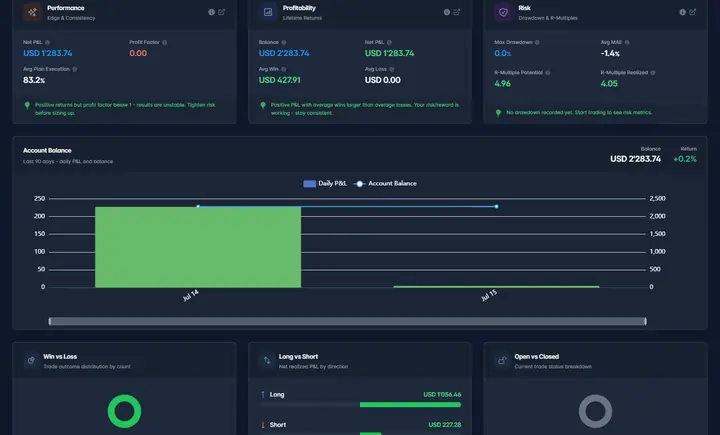
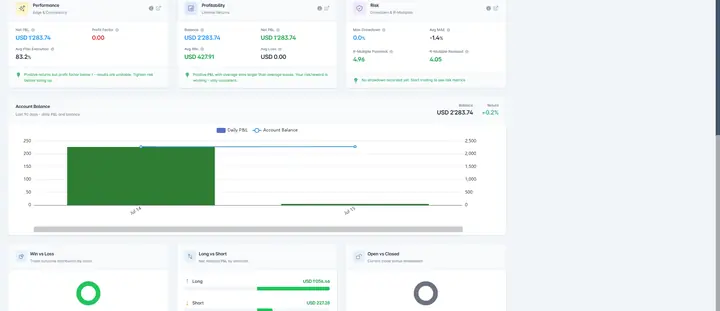
Your trading at a glance: performance, profitability and risk, your account balance, and a calendar with a summary of every trading day.
Log your closed trades — long or short, entry and exit — and get each trade's result and R-multiple for free. The dashboard, equity curve, analytics and breakdowns of all your trades are unlocked in the Trading Metrics app.
No trades yet. Add your closed trades one by one above — long or short, with the entry and exit — and the statistics appear below. Or load example trades to see how it works.
This page works out the result and R-multiple of each trade. Equity curve, drawdowns, statistics and every breakdown below are part of the Trading Metrics app — log your trades in its journal to unlock them.
Your trading at a glance: performance, profitability and risk, your account balance, and a calendar with a summary of every trading day.
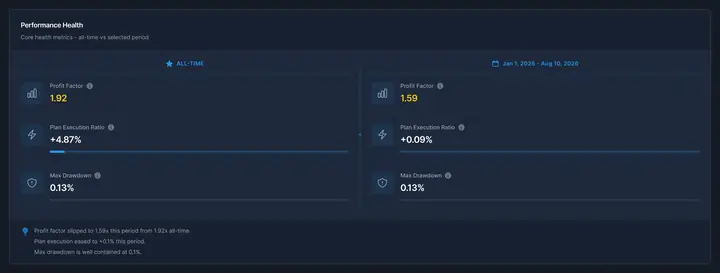
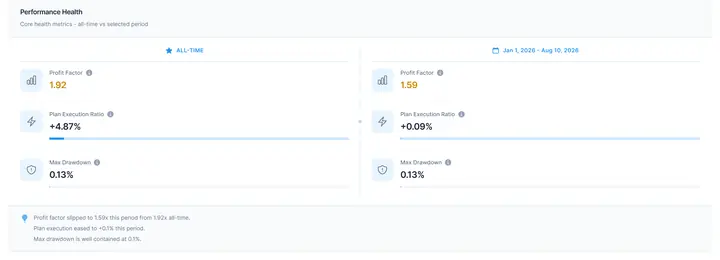
The diagnostics that show whether your edge is stable — not just whether last week was good.
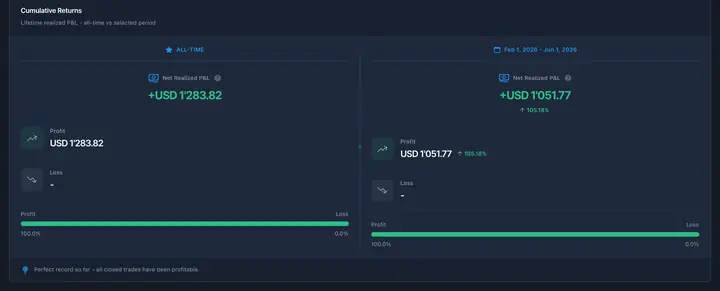
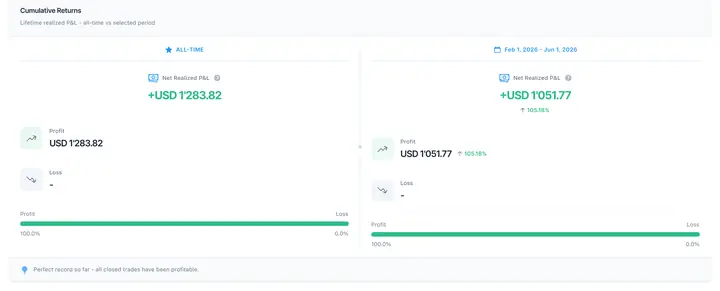
Your balance and cumulative returns over time, and how much of your gross performance trading costs take away.
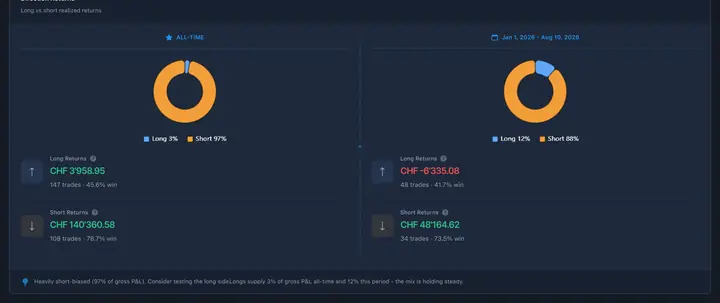
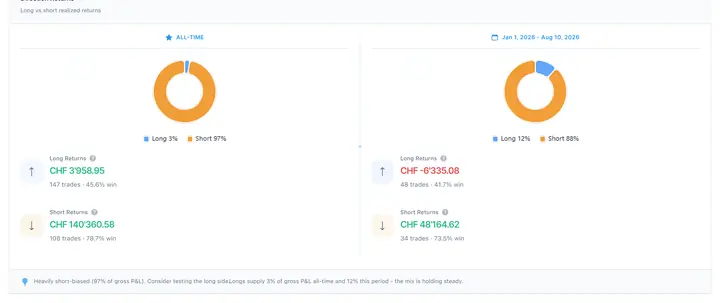
Closed-trade performance per trade and by direction — see whether your edge comes from longs, shorts or neither.
How well your stop-loss and target placement match how price actually moves after you enter.
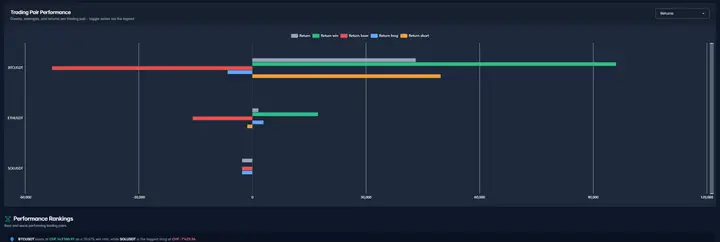
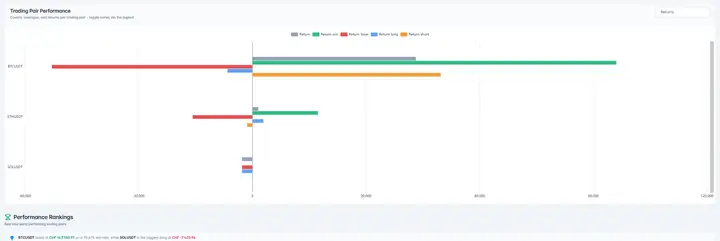
Your performance in every market you trade — find your most profitable pairs and cut the ones that lose.
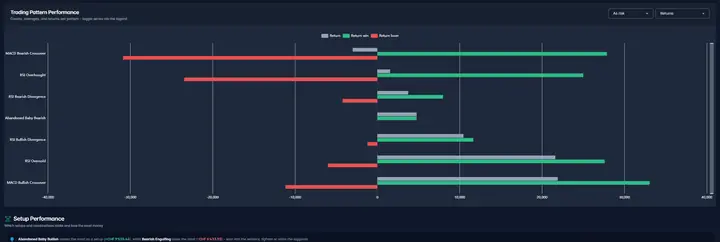
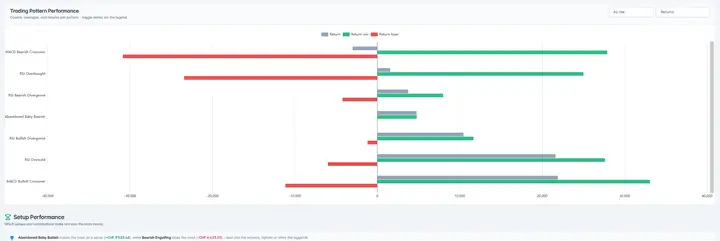
Which setups and chart patterns give you the best returns, the cleanest entries and the best risk/reward.
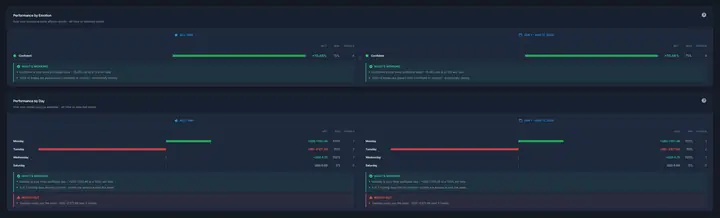
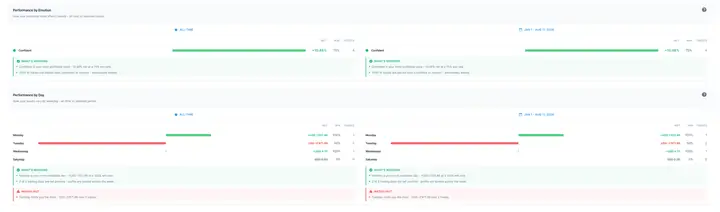
Your logged psychological state set against your results, and your trading plans ranked by the returns they actually produce.
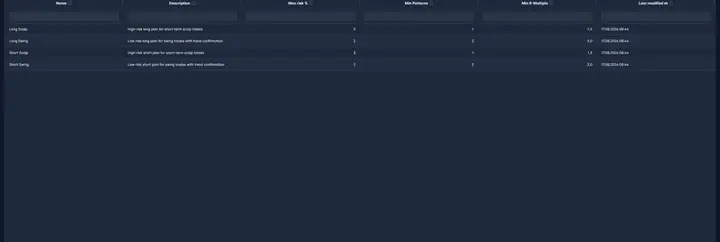
Playbooks with risk limits, required patterns and entry and exit checklists that keep every trade on plan.
Log your trades in the Trading Metrics journal and get the dashboard, analytics, R-multiples and breakdowns by trading pair, pattern and plan — in one place, for your whole history.
Note: at the time of writing, Trading Metrics doesn't yet sync trades from brokers automatically — you add them to the journal yourself. Automatic sync is planned for a future update. The journal and analytics are already available, so it's well worth a visit to try it out.
Not financial advice. Results are estimates based on the values you enter and simplified assumptions; real trades are affected by fees, slippage, gaps and other factors. Trading involves substantial risk of loss. Read the full disclaimer.
A long trade buys first and sells later: profit = (exit − entry) × amount. A short trade sells first and buys back later: profit = (entry − exit) × amount. Fees are subtracted from both. The initial risk (1R) is the distance from the entry to the stop-loss times the amount — below the entry for a long, above it for a short — and every result is also shown as a multiple of that risk.
For definitions of every metric, see the trade-specific metrics in the Trading Metrics docs.
No. Everything is calculated in your browser. The trades you add are saved only in this browser's local storage, so they are still there next time you open the page on this device. Use “Clear all” to delete them.
Choose Short, then enter the price you sold at as the entry and the price you bought back at as the exit. A short makes money when the exit is below the entry. The stop-loss of a short sits above the entry and its take-profit below it — the form checks this for you.
Direction, amount, entry price and exit price are enough to calculate the result. Add fees for the net result and the initial stop-loss for the trade's R-multiple. The take-profit and the entry and exit times are kept with the trade.
Here you log trades and get each trade's result and R-multiple. The analysis of your trades as a whole — dashboard and trading calendar, equity and returns, performance health, R-multiple and excursion analysis, and breakdowns by direction, trading pair, pattern, behaviour and trading plan — is part of the Trading Metrics app. Automatic broker sync isn't available there yet — it's planned — but you can already log trades and use the analytics.
Enter the number of lots or contracts as the amount, then open Settings under your trade list and set the contract multiplier — the value of a one-point move for one unit (100,000 for a standard forex lot, 50 for an E-mini S&P 500 contract).
The R-multiple divides the result by the money you risked, and that risk comes from the initial stop-loss. Add the stop-loss to the trade (below the entry for a long, above it for a short) and its R appears. See the R-multiple calculator for the method.
Note: at the time of writing, Trading Metrics doesn't yet sync trades from brokers automatically — you add them to the journal yourself. Automatic sync is planned for a future update. The journal and analytics are already available, so it's well worth a visit to try it out.